


▲上下滑动查看更多

文章来源:https://c1n.cn/PIZUq
背景
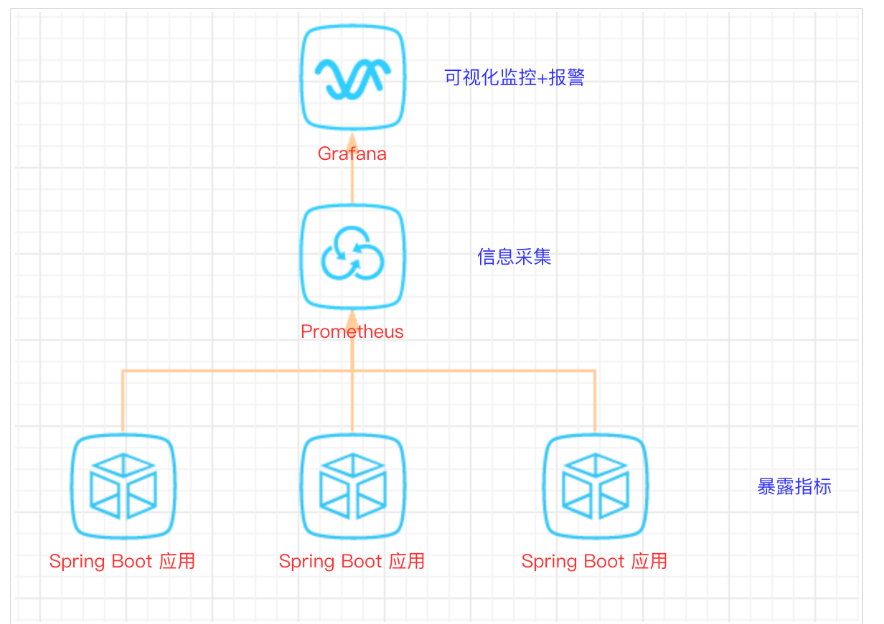
SpringBoot 的应用监控方案比较多,SpringBoot+Prometheus+Grafana 是目前比较常用的方案之一。
它们三者之间的关系大概如下图:
开发 SpringBoot 应用
<dependency>
            <groupId>org.springframework.boot</groupId>
            <artifactId>spring-boot-starter-actuator</artifactId>
        </dependency>
        <dependency>
            <groupId>org.springframework.boot</groupId>
            <artifactId>spring-boot-starter-web</artifactId>
        </dependency>

        <dependency>
            <groupId>org.projectlombok</groupId>
            <artifactId>lombok</artifactId>
            <optional>true</optional>
        </dependency>

        <!-- https://mvnrepository.com/artifact/io.prometheus/simpleclient_spring_boot -->
        <dependency>
            <groupId>io.prometheus</groupId>
            <artifactId>simpleclient_spring_boot</artifactId>
            <version>0.8.1</version>
        </dependency>

        <dependency>
            <groupId>org.springframework.boot</groupId>
            <artifactId>spring-boot-starter-security</artifactId>
        </dependency>
注意: 这里的 SpringBoot 版本是 1.5.7.RELEASE,之所以不用最新的 2.X 是因为最新的 simpleclient_spring_boot 只支持 1.5.X,不确定 2.X 版本的能否支持。
package cn.sp;

import io.prometheus.client.spring.boot.EnablePrometheusEndpoint;
import io.prometheus.client.spring.boot.EnableSpringBootMetricsCollector;
import org.springframework.boot.SpringApplication;
import org.springframework.boot.autoconfigure.SpringBootApplication;
@EnablePrometheusEndpoint
@EnableSpringBootMetricsCollector
@SpringBootApplication
public class MonitorDemoApplication {

    public static void main(String[] args) {
        SpringApplication.run(MonitorDemoApplication.class, args);
    }

}
server:
  port: 8848
spring:
  application:
    name: monitor-demo

security:
  user:
    name: admin
    password: 1234
  basic:
    enabled: true
    # 安全路径列表,逗号分隔,此处只针对/admin路径进行认证
    path: /admin

# actuator暴露接口的前缀
management:
  context-path: /admin
  # actuator暴露接口使用的端口,为了和api接口使用的端口进行分离
  port: 8888
  security:
    enabled: true
    roles: SUPERUSER
@RequestMapping("/heap/test")
@RestController
public class TestController {

    public static final Map<String, Object> map = new ConcurrentHashMap<>();

    @RequestMapping("")
    public String testHeapUsed() {
        for (int i = 0; i < 10000000; i++) {
            map.put(i + "", new Object());
        }
        return "ok";
    }
}
这里的逻辑就是在请求这个接口后,创建大量对象保存到 map 中增加堆内存使用量,方便后面测试邮件报警。
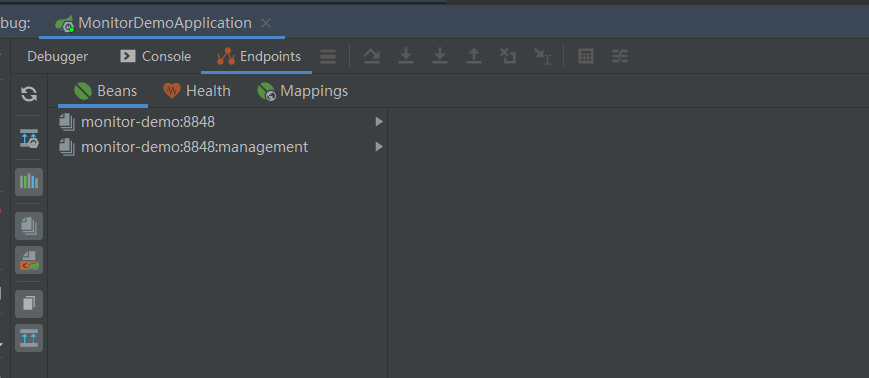
开始我的 IDEA 是不显示这个 Endpoints,后来发现是我使用的 idea 版本太老了,还是 2017.1 的, 而这个需要 idea2017.2 版本以上才能看到。后来只好重新下载安装,弄了好久...
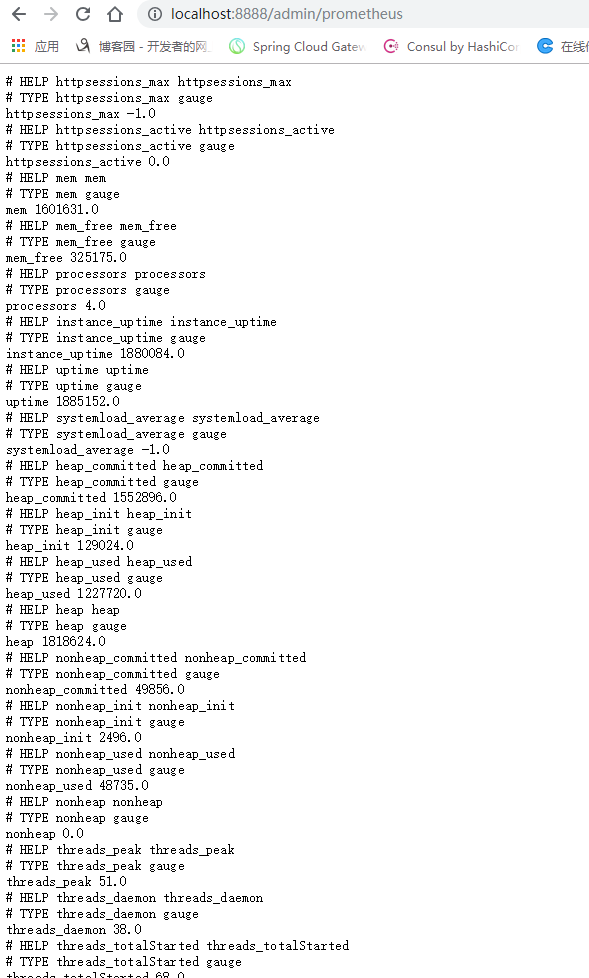
注意:由于开启了安全认证,所以访问这个 URL 的需要提示输入账号/密码,如果提示 404 请检查下你的请求地址是否正确,如果不设置 management.context-path 则默认地址是 http://ip:port/prometheus。
安装 Prometheus
本文下载的是 Windows 版本 prometheus-2.17.2.windows-amd64.tar.gz。
https://prometheus.io/download/
scrape_configs:
# The job name is added as a label `job=<job_name>` to any timeseries scraped from this config.
# - job_name: 'prometheus'
# metrics_path defaults to '/metrics'
# scheme defaults to 'http'.
# static_configs:
# - targets: ['localhost:9090']
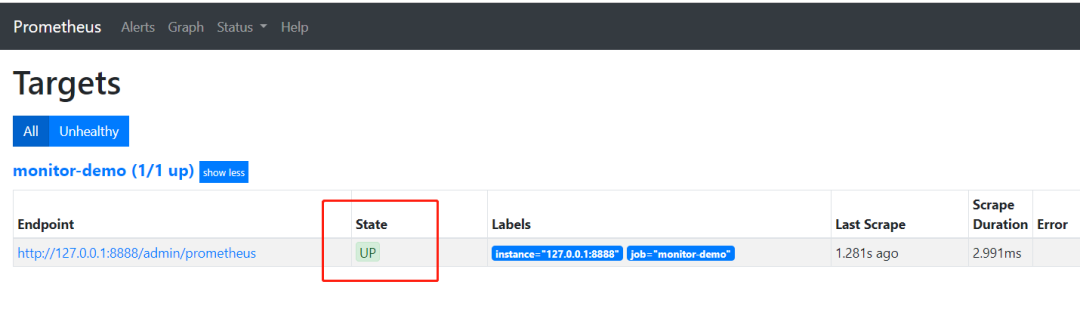
- job_name: 'monitor-demo'
scrape_interval: 5s # 刮取的时间间隔
scrape_timeout: 5s
metrics_path: /admin/prometheus
scheme: http
basic_auth: #认证信息
username: admin
password: 1234
static_configs:
- targets:
- 127.0.0.1:8888 #此处填写 Spring Boot 应用的 IP + 端口号
prometheus.exe --config.file=prometheus.yml
安装 Grafana
本文用到的是 Windows 版本 grafana-6.3.3.windows-amd64.zip。
https://grafana.com/grafana/download
解压后运行 bin 目录下的 grafana-server.exe 启动,游览器访问 http://localhost:3000 即可看到登录页面,默认账号密码是 admin/admin。
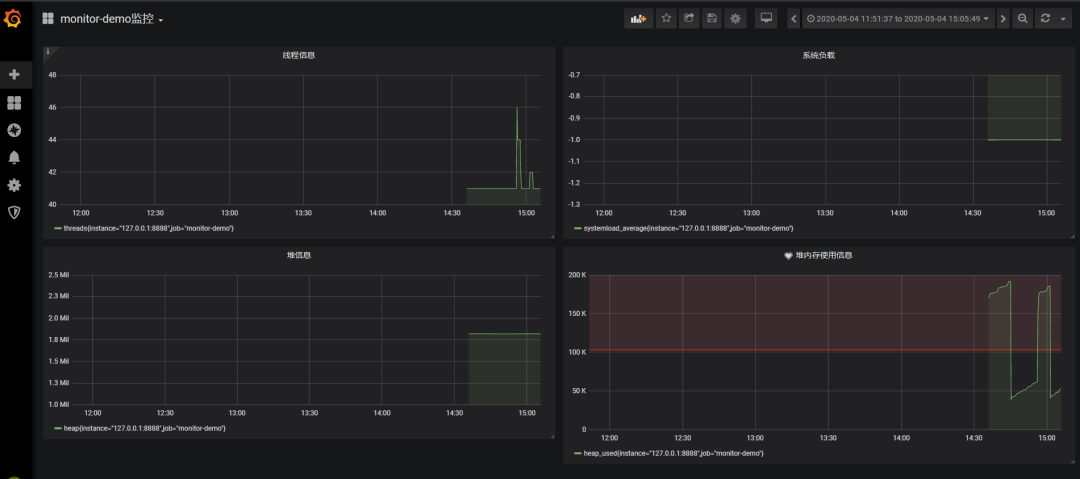
现在开始创建自己的可视化监控面板。
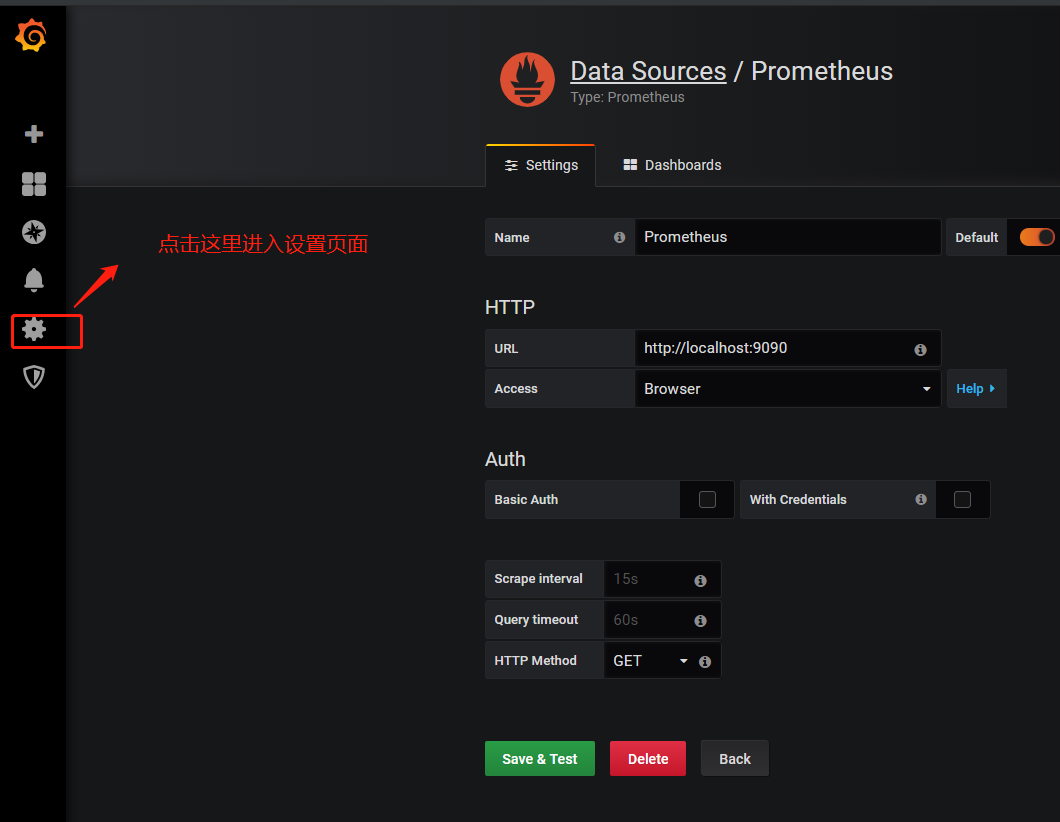
| 设置数据源
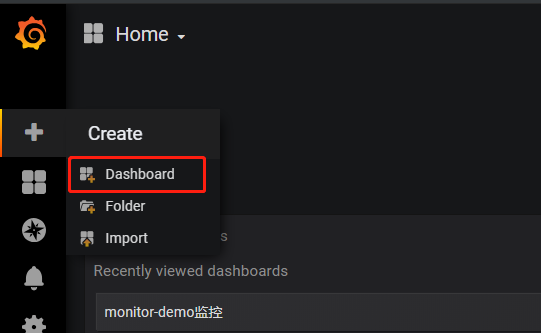
| 创建一个 Dashboard
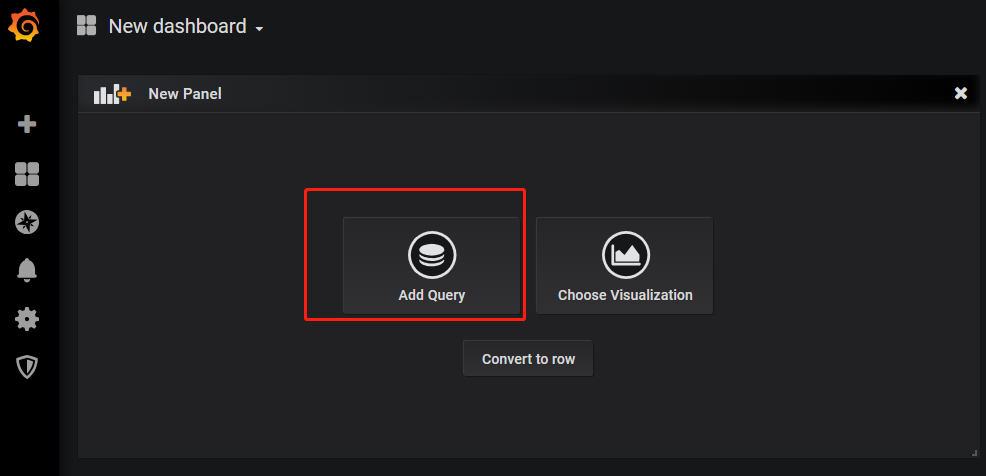
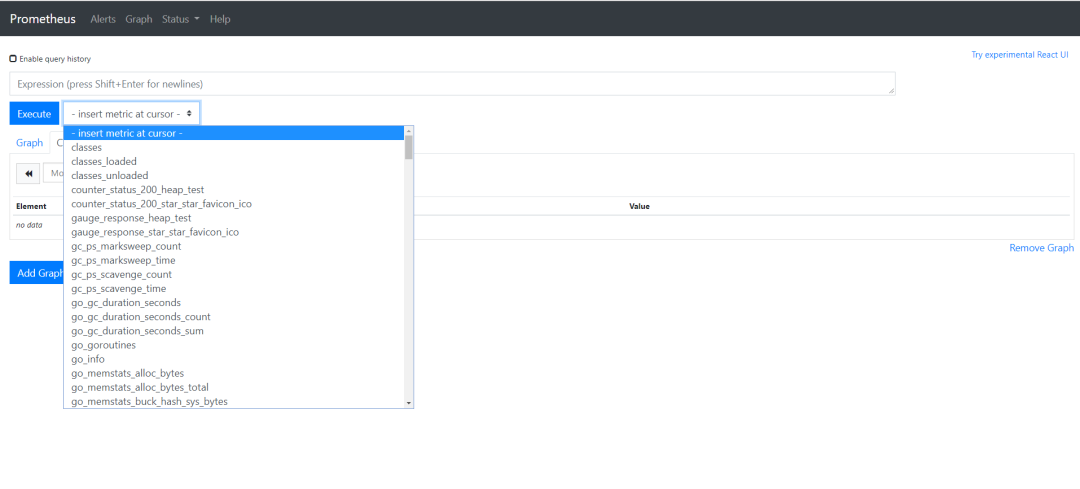
| 填写采集的指标点
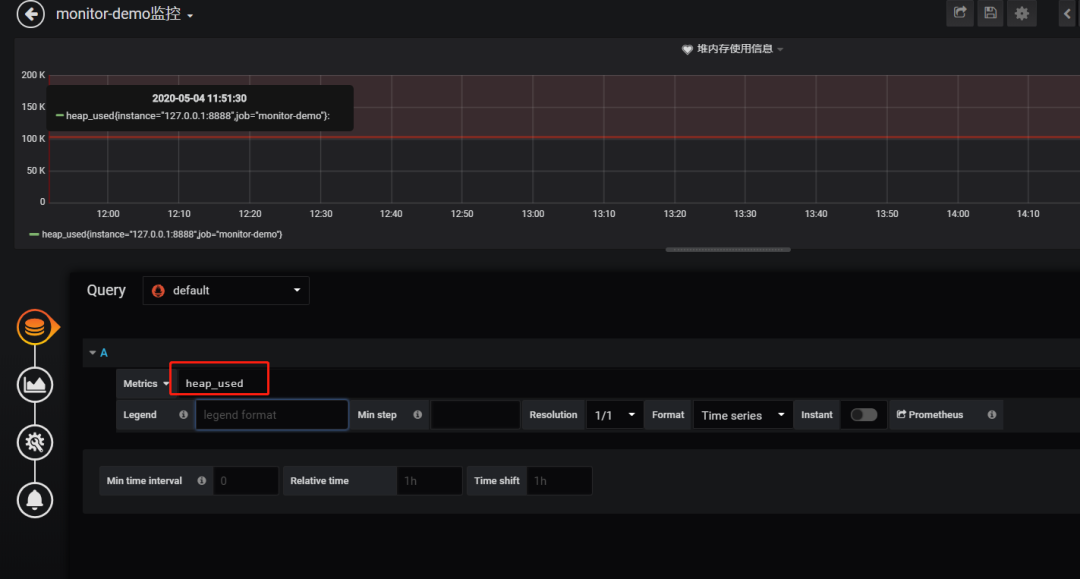
注意: 这里的指标点不能随便填,必须是已有的可以在 Prometheus 看到。
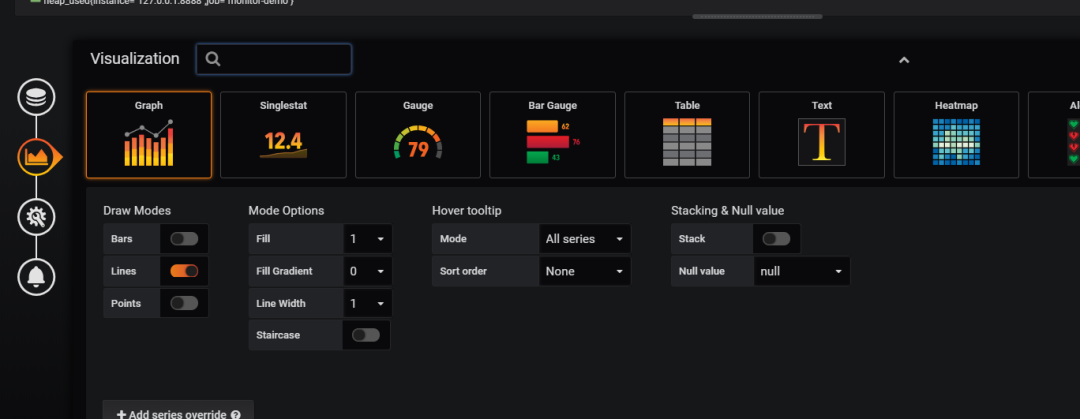
| 选择图表样式
| 填写标题描述
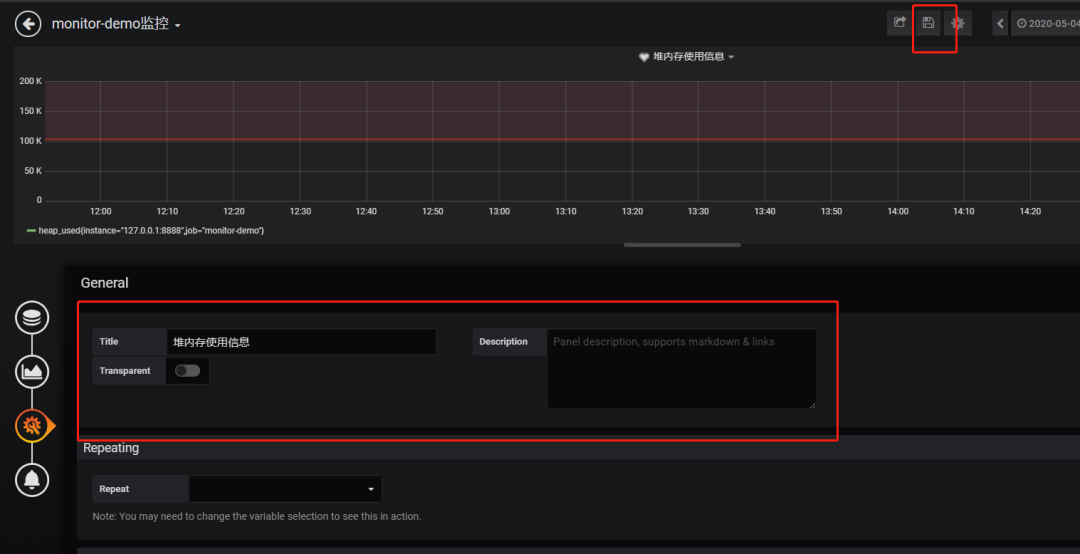
Tips:这里的图表布局是可以用鼠标拖动的。
添加邮件报警
在实际项目中当监控的某的个指标超过阈值(比如 CPU 使用率过高),希望监控系统自动通过短信、钉钉和邮件等方式报警及时通知运维人员,Grafana 就支持该功能。
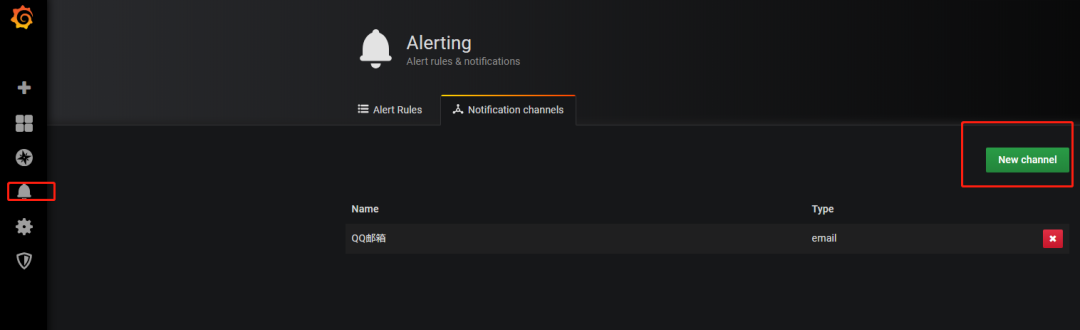
第一步:点击[Alerting]——>[Notification channels]添加通知通道
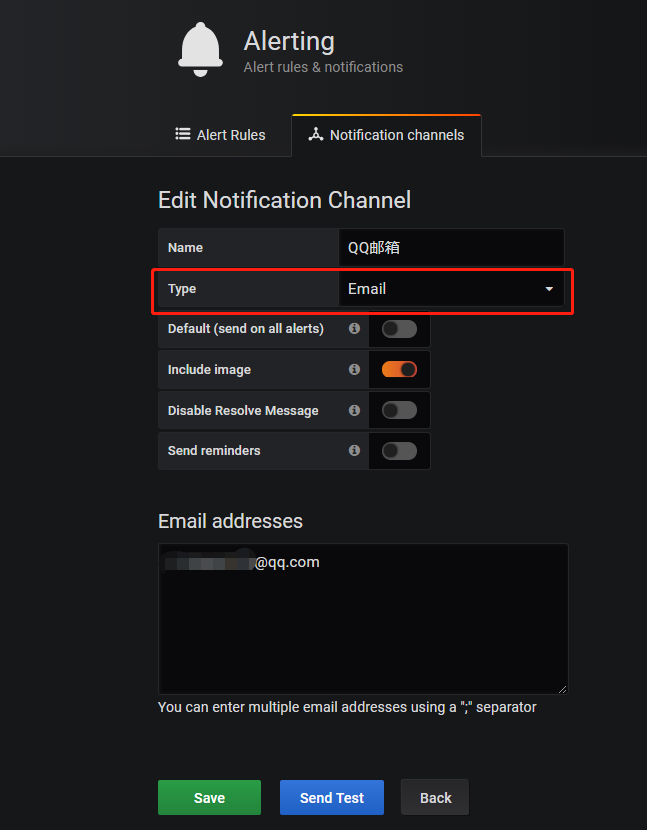
第二步:邮箱配置
Grafana 默认使用 conf 目录下 defaults.ini 作为配置文件运行,根据官方的建议我们不要更改 defaults.ini 而是在同级目录下新建一个配置文件 custom.ini。
#################################### SMTP / Emailing #####################
[smtp]
enabled = true
host = smtp.exmail.qq.com:465
user = [email protected]
# If the password contains # or ; you have to wrap it with triple quotes. Ex """#password;"""
password = XXX
cert_file =
key_file =
skip_verify = true
from_address = [email protected]
from_name = Grafana
ehlo_identity = ininin.com
grafana-server.exe -config=E:\file\grafana-6.3.3\conf\custom.ini
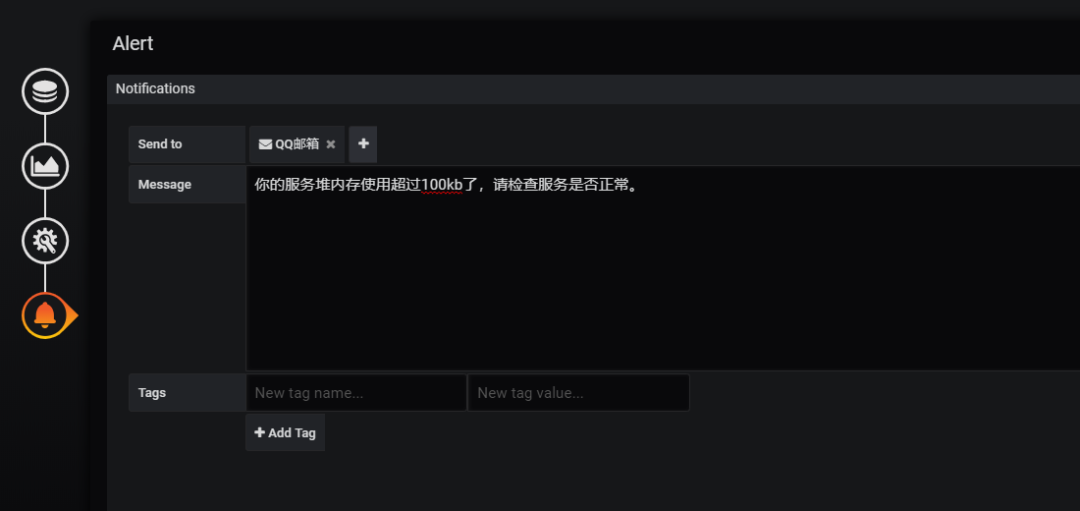
第三步:为指标添加 alert
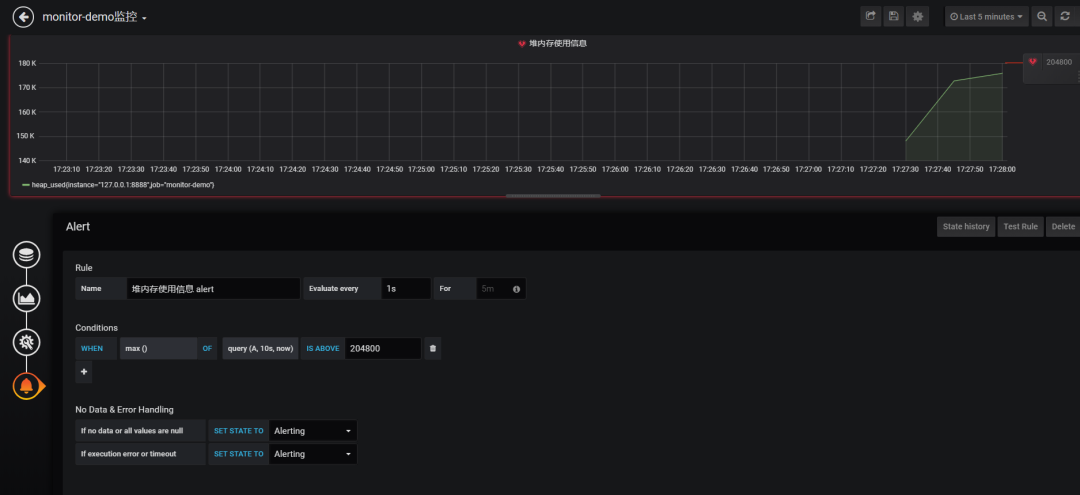
Evaluate every:表示检测评率,这里为了测试效果,改为 1 秒。
For:如果警报规则配置了 For,并且查询违反了配置的阈值,那么它将首先从 OK 变为 Pending。从 OK 到 Pending Grafana 不会发送任何通知。一旦警报规则的触发时间超过持续时间,它将更改为 Alerting 并发送警报通知。
Conditions:when 表示什么时间,of 表示条件,is above 表示触发值 同时,设置了 is above 后会有一条红线。
If no data or all values are null:如果没有数据或所有值都为空,这里选择触发报警。
If execution error or timeout:如果执行错误或超时,这里选择触发报警。
注意:下一次触发,比如 10 秒后,它不会再次触发,防止报警风暴产生!
第四步: 测试
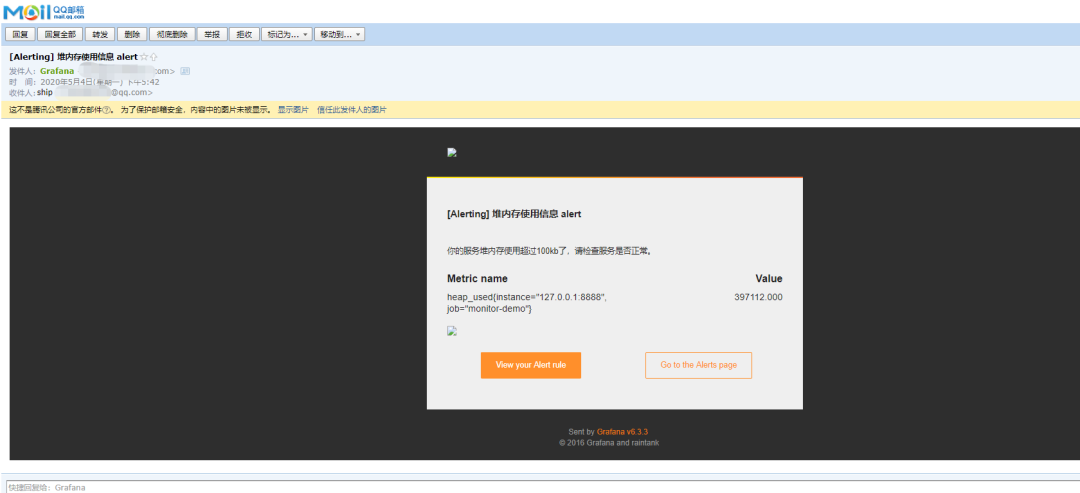
这里图片没有显示出来,搞不懂为什么。
总结
这套监控功能还是挺强大的,就是 Prometheus 的表达式有点多。
附上几个链接:
-
Prometheus 官方文档:https://prometheus.io/docs/introduction/first_steps/
-
Grafana 官方文档:https://grafana.com/docs/grafana/latest/
-
代码地址:https://github.com/2YSP/monitor-demo
------------- END -------------


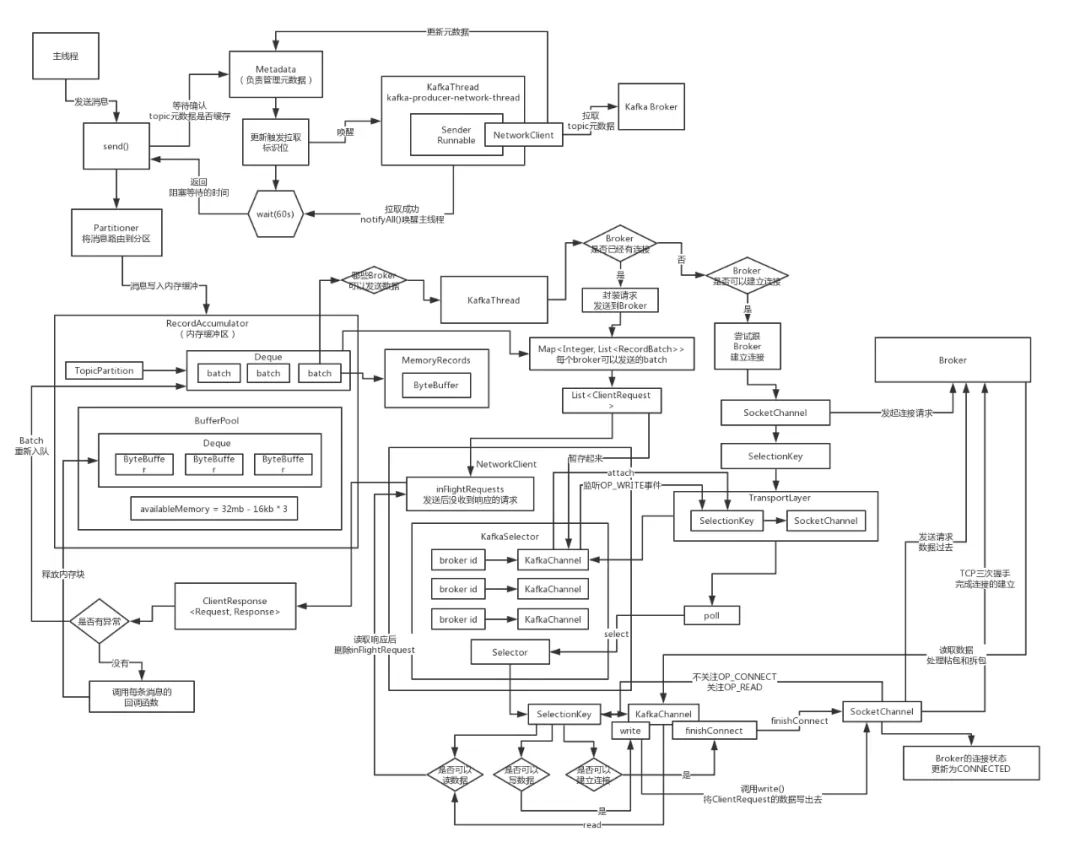
Kafka Producer内核源码剖析
部分资料详情

点个在看你最好看


文章评论