linux_examples148(20220804)
参考:
https://github.com/prometheus/blackbox_exporter
一、准备工作
1、包的版本
prometheus-2.18.1.linux-amd64.tar.gz
blackbox_exporter-0.22.0.linux-amd64.tar.gz
2、我这里接入了supervisord管理的服务 默认的是9115端口
cat /etc/supervisord.d/prometheus_blackbox_exporter.ini
[program:prometheus_blackbox_exporter]
command=nohup ./blackbox_exporter --web.listen-address=":9115"
directory=/root/ceph_monitor/blackbox_exporter
autostart=false
autorestart=true
stopwaitsecs=1
startsecs=3
user=root
stopasgroup=true
stdout_logfile=/root/ceph_monitor/blackbox_exporter/log/prometheus_blackbox_exporter.log
stderr_logfile=/root/ceph_monitor/blackbox_exporter/log/prometheus_blackbox_exporter.errlog
二、部署
1、修改配置blackbox.yml
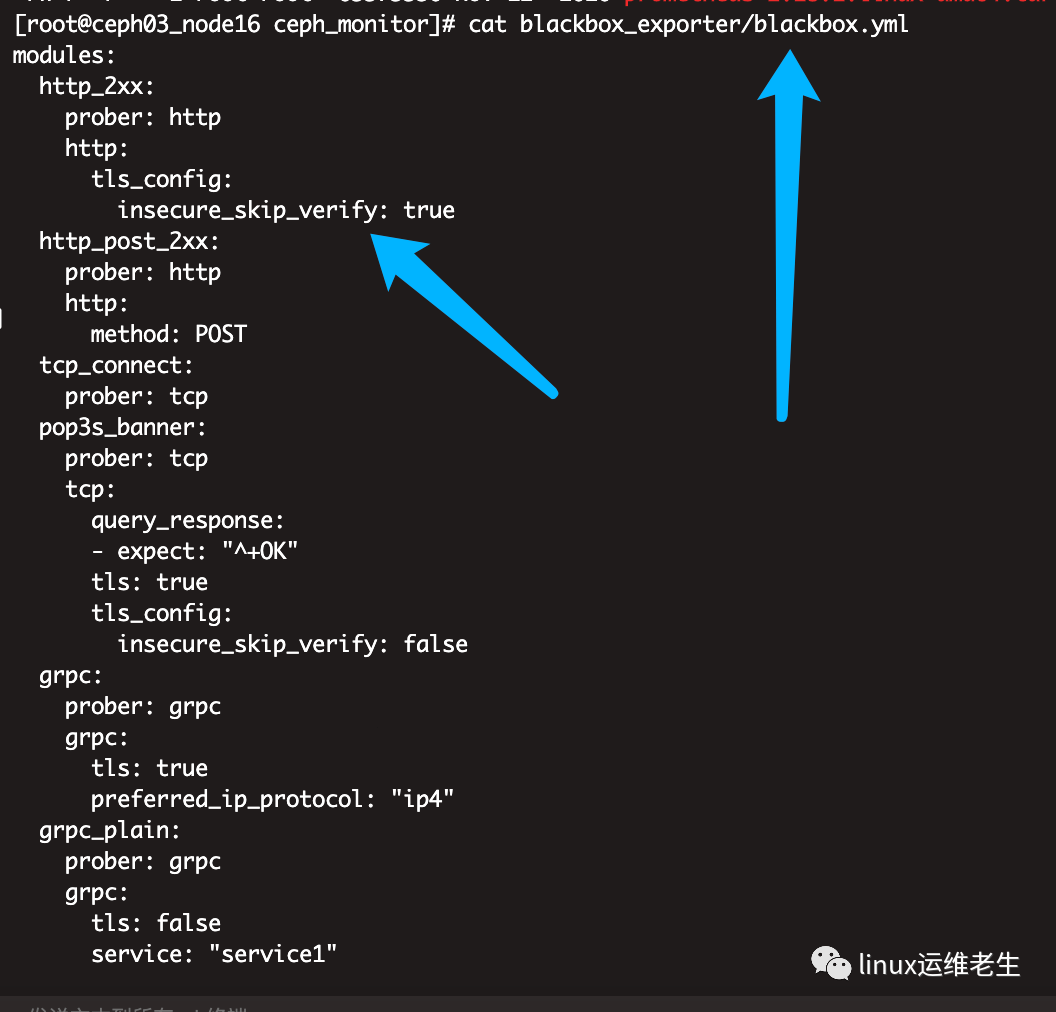
modules:
http_2xx:
prober: http
http:
tls_config:
insecure_skip_verify: true
增加了以下三行信息 注意格式
http:
tls_config:
insecure_skip_verify: true
修改的配置是为了解决这个错误信息
prometheus x509 certificate signed by unknown authority
2、直接增加job 我这里提供一个站点的 多个站点可以写在一起 也可以分开的
- job_name: 'zabbix_server'
metrics_path: /probe
params:
module: [http_2xx]
static_configs:
- targets:
- http://zabbix.mingmatechs.com/zabbix
relabel_configs:
- source_labels: [__address__]
target_label: __param_target
- source_labels: [__param_target]
target_label: instance
- target_label: __address__
replacement: 127.0.0.1:9115
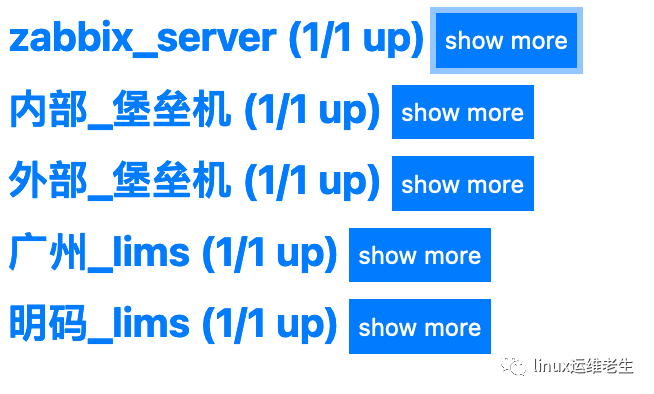
3、加完后就有了 我这里监控了5个站点 举例的就贴一个了
4、我这里新增了一个yml
# Load rules once and periodically evaluate them according to the global 'evaluation_interval'.
rule_files:
- "first_rules.yml"
- "second_rules.yml"
- "third_rules.yml"
主配置里我增加了1个third_rules.yml
具体配置
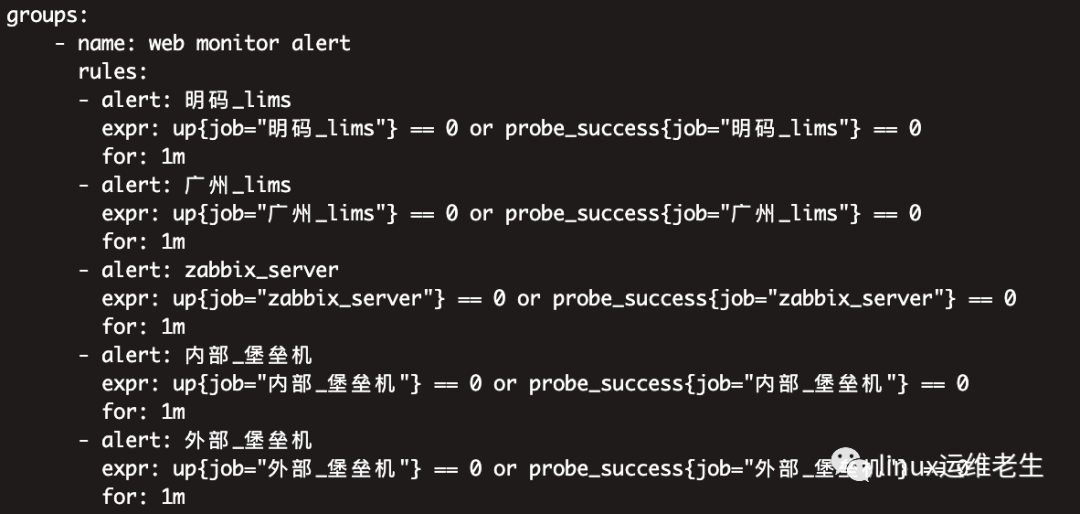
cat third_rules.yml
groups:
- name: web monitor alert
rules:
- alert: 明码_lims
expr: up{job="明码_lims"} == 0 or probe_success{job="明码_lims"} == 0
for: 1m
- alert: 广州_lims
expr: up{job="广州_lims"} == 0 or probe_success{job="广州_lims"} == 0
for: 1m
- alert: zabbix_server
expr: up{job="zabbix_server"} == 0 or probe_success{job="zabbix_server"} == 0
for: 1m
- alert: 内部_堡垒机
expr: up{job="内部_堡垒机"} == 0 or probe_success{job="内部_堡垒机"} == 0
for: 1m
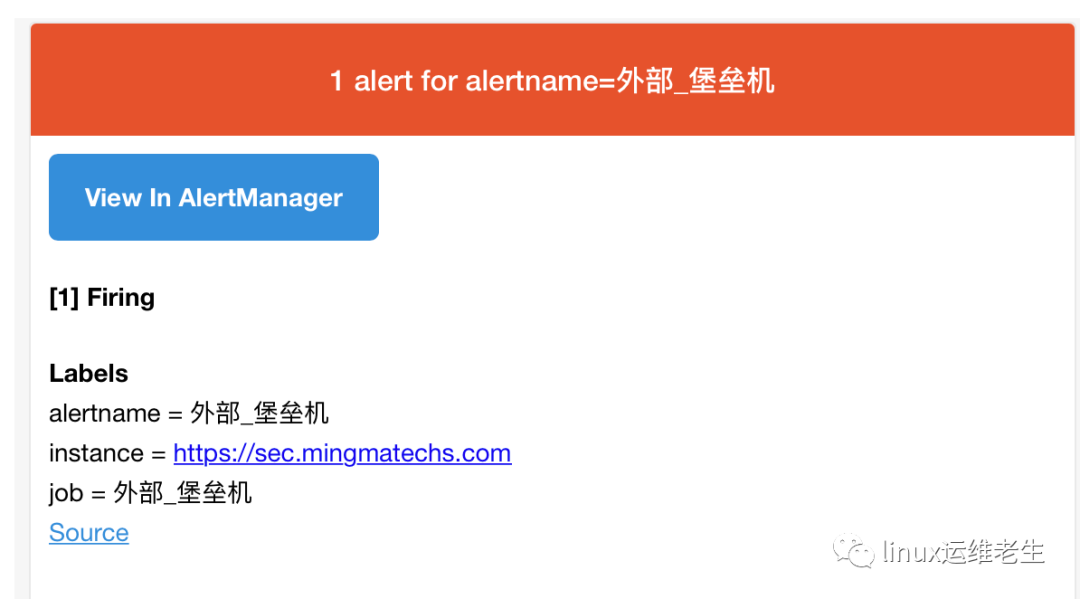
- alert: 外部_堡垒机
expr: up{job="外部_堡垒机"} == 0 or probe_success{job="外部_堡垒机"} == 0
for: 1m
5、重新加载生效
supervisorctl update
supervisorctl restart prometheus_blackbox_exporter
curl -X POST http://localhost:9090/-/reload
三、告警测试
1、http站点测试
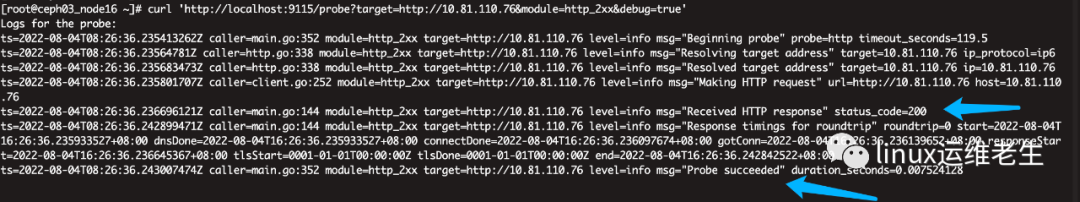
curl 'http://localhost:9115/probe?target=http://10.81.110.76&module=http_2xx&debug=true'
2、https站点测试
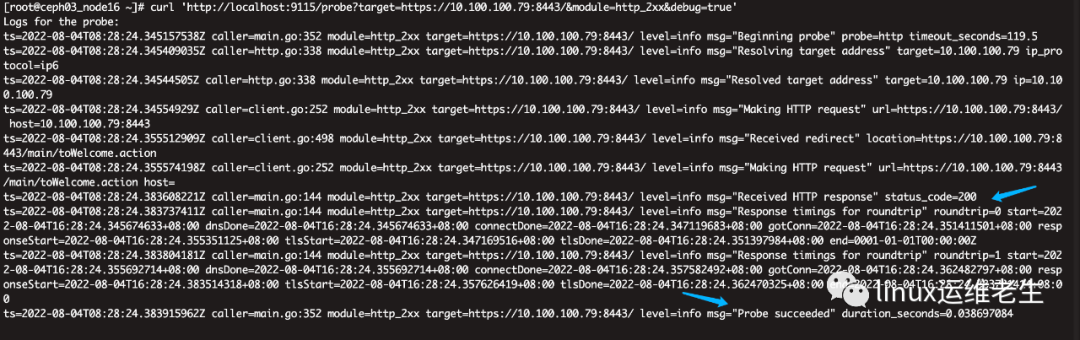
curl 'http://localhost:9115/probe?target=https://10.100.100.79:8443/&module=http_2xx&debug=true'
PS:实际url地址是这个 默认会进行转发检测 具体还是看module 下面贴出来了
https://10.100.100.79:8443/main/toWelcome.action
3、具体使用Module配置信息
Module configuration:
prober: http
http:
ip_protocol_fallback: true
tls_config:
insecure_skip_verify: true
follow_redirects: true
enable_http2: true
tcp:
ip_protocol_fallback: true
icmp:
ip_protocol_fallback: true
ttl: 64
dns:
ip_protocol_fallback: true
recursion_desired: true
四、效果

文章评论