[VUE2]基于vue-workflow-chart的DEG图组件
vue-workflow-chart调用
 <workflow-chart
      :style='size'
      :transitions='transitions'
      :states='states'
      :stateSemantics='stateSemantics'
      :orientation="isHorizontal ? 'horizontal' : 'vertical'"
      @state-click="onStateClick($event)"
      @transition-click="onLabelClicked('transition', $event)"
      @sizeChange='sizeChanged'
    />
官方demo
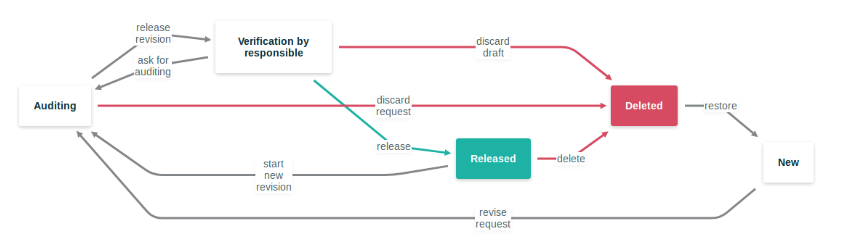
<template>
    <div id="app">
        <workflow-chart
            :transitions="transitions"
            :states="states" />
    </div>
</template>

<script>
import WorkflowChart from 'vue-workflow-chart';

export default {
    name: "App",
    components: {
        WorkflowChart,
    },
    data: () => ({
        states: [{
            "id": "state_1",
            "label": "State 1",
        }, {
            "id": "state_2",
            "label": "State 2",
        }],
        transitions: [{
            "id": "transition_1",
            "label": "this is a transition",
            "target": "state_2",
            "source": "state_1",
        }],
    }),
};
</script>
自定义组件效果
主要是重写了一下样式,自定义每个节点里的图片,达到workflow DEG图的效果。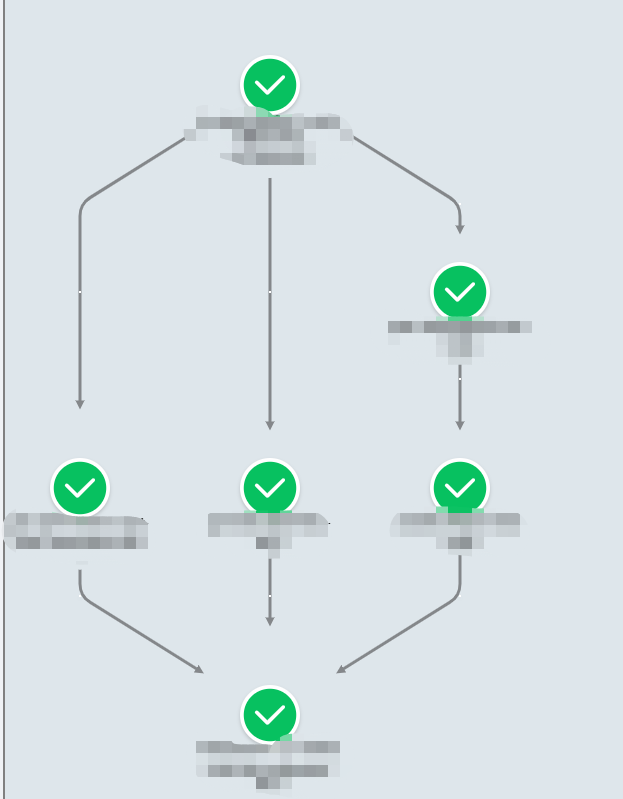
自定义组件调用
<Workflow :nodeData='nodeData' :isHorizontal='isHorizontal' @clickNode='clickNode' v-dragScroll />
自定义组件代码
<template>
  <div class='hzs-workflow-chart-box' ref='box'>
    <workflow-chart
      :style='size'
      :transitions='transitions'
      :states='states'
      :stateSemantics='stateSemantics'
      :orientation="isHorizontal ? 'horizontal' : 'vertical'"
      @state-click="onStateClick($event)"
      @transition-click="onLabelClicked('transition', $event)"
      @sizeChange='sizeChanged'
    />
  </div>
</template>
<script>
import WorkflowChart from 'vue-workflow-chart'

const phaseToClass = {
  Succeeded: 'succeeded',
  Running: 'running',
  Pending: 'pending',
  Omitted: 'omitted',
  Failed: 'failed'
}

export default {
  name: 'Workflow',
  components: {
    WorkflowChart
  },
  props: {
    nodeData: {
      type: Object,
      default: () => ({})
    },

    isHorizontal: {
      type: Boolean,
      default: false
    }
  },
  watch: {
    nodeData: {
      handler: function(newVal) {
        console.log('检测到有新的节点数据')
        console.log(newVal)
        this.composeChartData(newVal.status.nodes)
        setTimeout(this.dealWordPosition)
      },
      deep: true
    }
  },
  data: () => ({
    states: [],
    transitions: [],
    stateSemantics: [],
    size: { width: '0px', height: '0px' }

  }),

  methods: {
    onStateClick(e) {
      console.log('点击了节点')
      console.log(e)
      this.$emit('clickNode', e)
    },
    addData() {
      for (let i = 0; i < 100; i++) {
        this.states.push({
          id: `node${i}`,
          label: `node${i}`
        })
      }
      for (let i = 0; i < 50; i++) {
        this.transitions.push({

          'label': '',
          'source': `node${i}`,
          'target': `node${i + 1}`
        })
      }

      for (let i = 50; i < 100; i++) {
        this.transitions.push({
          'label': '',
          'source': `node${i - 50}`,
          'target': `node${i}`
        })
      }

    },
    sizeChanged(size) {
      this.size = {
        width: `${size.width}px`,
        height: `${size.height}px`
      }
    },

    // 组装成图的数据
    composeChartData(dataObj) {
      if (!dataObj || JSON.stringify(dataObj) === '{}' || dataObj.length < 1) {
        return
      }
      let nodeList = []
      let lineList = []
      let stateSemanticList = []

      Object.keys(dataObj).forEach((key) => {
        let node = dataObj[key]
        console.log(node)

        // 放入节点
        nodeList.push({
          'id': node.id,
          'label': node.displayName
        })

        // 放入节点状态信息
        stateSemanticList.push({
          'id': node.id,
          'classname': phaseToClass[node.phase]
        })

        // 放入连线的情况
        if (node.children && node.children.length > 0) {
          node.children.forEach((child, index) => {
            lineList.push({
              'id': `${node.id}-${index}`,
              'target': child,
              'source': node.id
            })
          })

        }
      })

      console.log('组装出来的数据')
      console.log(nodeList)
      console.log(lineList)

      this.states = nodeList
      this.transitions = lineList
      this.stateSemantics = stateSemanticList
    },


    getMaxHeight() {
      let maxHeight = 0
      let nodeList = document.getElementsByClassName('vue-workflow-chart-state')

      for (let i = 0; i < nodeList.length; i++) {
        if (nodeList[i].style.top) {
          let top = +nodeList[i].style.top.split('px')[0]
          if (top > maxHeight) {
            maxHeight = top
          }
        }
      }

      console.log(this.$refs.box)
    },


    // 调整文字位置
    dealWordPosition() {
      let nodeList = document.getElementsByClassName('vue-workflow-chart-state')

      for (let i = 0; i < nodeList.length; i++) {
        // console.log(nodeList[i])
        let label = nodeList[i].innerText

        let element = document.createElement('p')
        element.innerText = label
        element.className = 'vue-workflow-chart-state-text'

        nodeList[i].innerText = ''
        nodeList[i].appendChild(element)

      }
    },


    onLabelClicked(type, id) {
      console.log('点击了节点')
      alert(`Clicked on ${type} with id: ${id}`)
    }
  },

  created() {
    // this.addData()
    // this.composeChartData(this.nodeData.status.nodes)
  },
  mounted() {
    //
    // this.getMaxHeight()
  }
}
</script>
<style lang='less'>
@import '~vue-workflow-chart/dist/vue-workflow-chart.css';

.hzs-workflow-chart-box {
  min-height: 800px;
  //border: 1px solid black;
  overflow: auto;
  //margin-left: 50px;
  position: relative;


  .vue-workflow-chart-state {
    padding: 0;
    margin: 0;
    z-index: 999;
    //border: 2px solid black;
    border-radius: 50%;
    width: 60px;
    height: 60px;

    overflow: visible;
    color: black;
    font-size: 8px;
    //background-color: white;
    //position: relative;
    //font-weight: 500;
    //flex-wrap: nowrap;

    //display: flex;
    //justify-content: flex-end;
    //background-image: url("/img/success.svg");
    background-position: center;
    background-origin: content-box;
    background-attachment: local;
    background-size: 100%;
    //background-size: cover;
    background-repeat: no-repeat;

    p {
      position: absolute;
      left: 30px;
      top: 55px;
      width: 150px;
      transform: translate(-50%);
    }
  }

  .vue-workflow-chart-state-delete {
    color: white;
    background: red;
  }


  .vue-workflow-chart-state-succeeded {
    //color: white;
    //background: green;
    //background: #00FF00 url("/img/success.svg") no-repeat fixed top;
    //background-image: url("/img/success.svg");
    background-image: url("/img/success.svg");

  }

  .vue-workflow-chart-state-running {
    background-image: url("/img/loading.gif");

  }

  .vue-workflow-chart-state-pending {
    background-image: url("/img/wait.svg");
    //background-size: cover;
    //background: gray;
  }

  .vue-workflow-chart-state-omitted {
    background-image: url("/img/ignore.svg");
    //background-size: cover;
  }

  .vue-workflow-chart-state-failed {
    background-image: url("/img/fail.svg");
    //background-size: cover;
  }


  .vue-workflow-chart-transition-arrow-delete {
    fill: red;
  }

  .vue-workflow-chart-transition-path-delete {
    stroke: red;
  }
}

</style>

文章评论