

在Java中,我们用Junit做单元测试,用JMH做性能基准测试(benchmark),用async-profiler剖析cpu性能,用jstack、jmap、arthas等来排查问题。
作为一名比较新的编程语言,golang的这些工具是否更加好用呢?
单元测试
Java的单元测试需要使用第三方库,一般是Junit,配置起来比较复杂。在使用了golang之后发现golang自带的单元测试真的非常简单。
如果我们有一个cal.go文件,那么其对应的单元测试文件为cal_test.go,其中的方法命名必须为TestXxx,这种按照命名进行单元测试的方式简单有效,也正是通常所说的“约定大于配置”。
来看一个简单的例子:
package unit


func add(a int, b int) int {
   return a + b
}


func sub(a int, b int) int {
   return a - b
}
package unit


import (
    "github.com/stretchr/testify/assert"
    "testing"
)


func TestAdd(t *testing.T) {
    assert.Equal(t, 10, add(5, 5))
}


func TestSub(t *testing.T) {
    assert.Equal(t, 0, sub(5, 5))
}
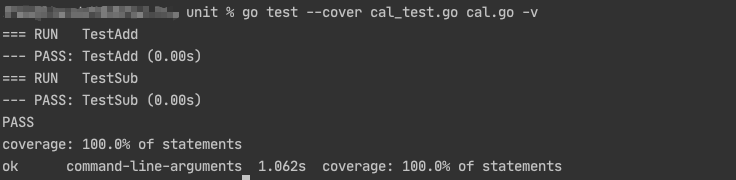
执行单元测试只需要运行(更多用法参考go help test)
go test --cover cal_test.go cal.go -v
benchmark
和单元测试类似,golang的benchmark也是开箱即用。在cal_test.go基础上增加一个BenchmarkAdd方法
package unit


import (
   "github.com/stretchr/testify/assert"
   "testing"
)


func TestAdd(t *testing.T) {
   assert.Equal(t, 10, add(5, 5))
}


func TestSub(t *testing.T) {
   assert.Equal(t, 0, sub(5, 5))
}


func BenchmarkAdd(b *testing.B) {
   for i:= 0; i < b.N; i++ {
      add(5, 5)
   }
}
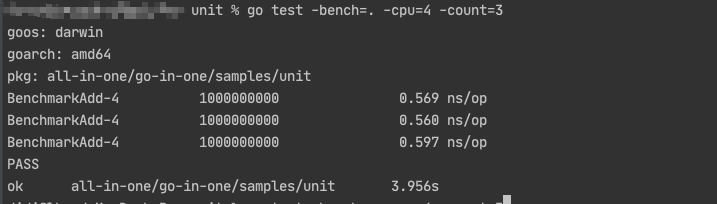
执行即可(更多用法参考go help test)
go test -bench=. -cpu=4 -count=3
pprof
pprof是golang自带的可以用来做cpu、内存、锁分析的工具,非常类似java的async-profiler。
pprof的使用非常简单,只需要在代码中引入net/http/pprof包,然后监听一个端口即可。
一个简单的例子如下:
package main


import (
    "fmt"
    "log"
    "net/http"
    "time"
    _ "net/http/pprof"
)


func main() {


    go func() {
        //example: visit http://127.0.0.1:6060/debug/pprof in browser.
        err := http.ListenAndServe("0.0.0.0:6060", nil)
        if err != nil {
            fmt.Println("failed to start pprof goroutine:", err)
        }
    }()


    http.HandleFunc("/", handler)
    log.Fatal(http.ListenAndServe("localhost:8000", nil))
}


func handler(w http.ResponseWriter, r *http.Request) {


    time.Sleep(1 * time.Second)


    eat()


    time := time.Now().Unix() * 2 + 1000000


    fmt.Fprintf(w, "URL.Path = %q; time = %d\n", r.URL.Path, time)
}


func eat() {
    loop := 10000000000
    for i := 0; i < loop; i++ {
        // do nothing
    }
}
在命令行中输入
go tool pprof http://127.0.0.1:6060/debug/pprof/profile
同时不停的请求,让pprof能采集到数据,这里我的请求是
curl http://127.0.0.1:8000/hello
等待30秒后,采集结束会显示采集文件的地址
Saved profile in /Users/roshi/pprof/pprof.samples.cpu.003.pb.gz
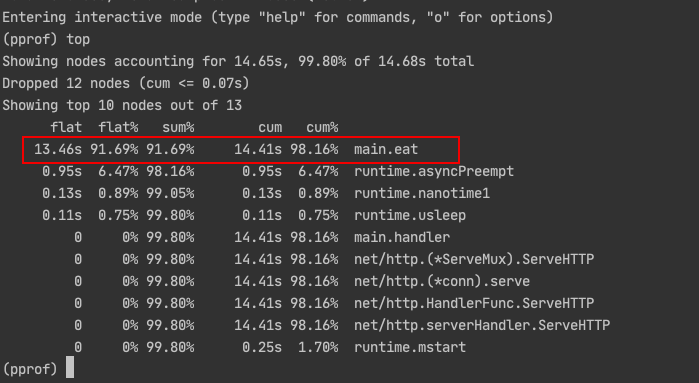
此时可以使用top等命令直接查看cpu消耗过高的函数,更多命令可以使用help查看。
 或者把文件下载下来用可视化的界面来分析,可以使用
go tool pprof -http=":8080" /User/roshi/pprof/pprof.samples.cpu.003.pb.gz
来开启一个可视化的页面,查看,如果报错需要安装graphviz,安装文档在这里可以查找:
https://graphviz.gitlab.io/download/
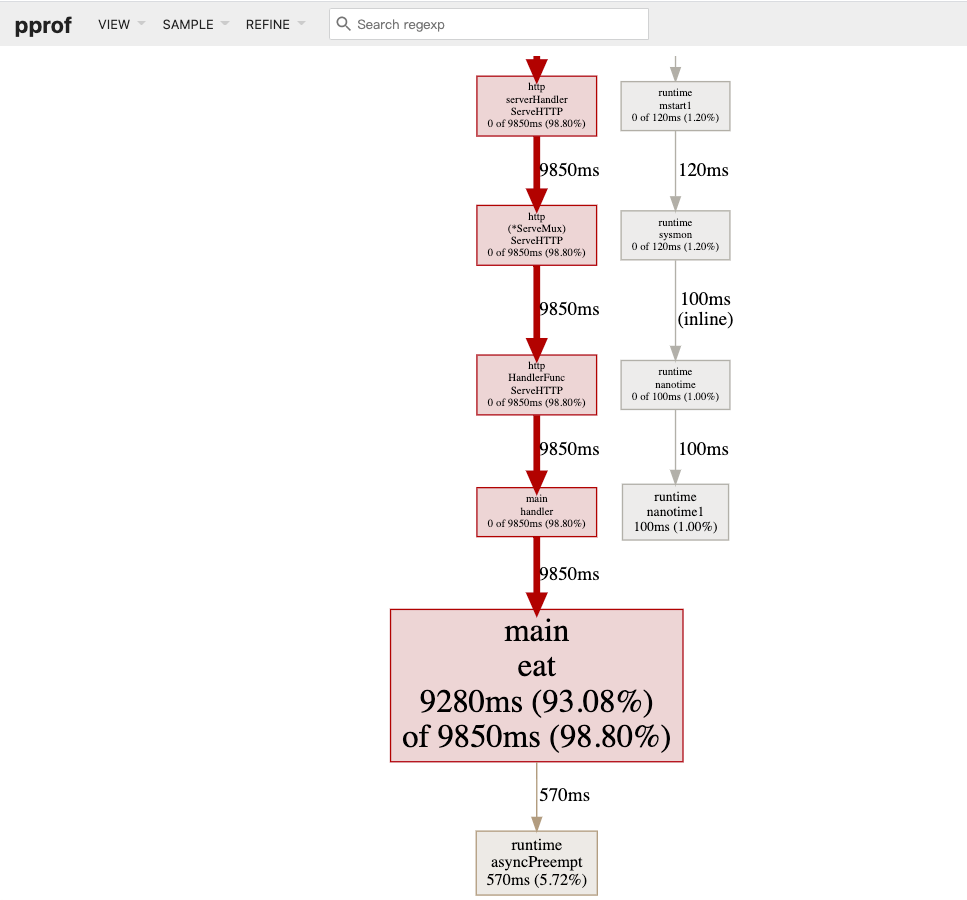
访问 http://localhost:8080/ui/ 可以看到下图,其中面积最大的块表示消耗cpu最多
这里有一篇文章对pprof介绍的很仔细,可以参考
https://blog.wolfogre.com/posts/go-ppof-practice/
dlv
pprof很好用,但有一个缺点是必须事先在代码中开启,如果线上出问题且没有开启pprof,可能就需要类似jstack、jmap、arthas等这类工具来排查。这里推荐一个最近使用过非常好用的golang问题排查利器——dlv,项目地址见
https://github.com/go-delve/delve
它很有用的一个功能是attach,可以attach到正在运行的golang程序,查看goroutine。这点可以很好的排查线上问题。
各个平台的安装在github上写的很清楚,需要说明的是安装dlv的golang版本和要排查进程的golang版本需要保持一致。
先写一个测试程序,起两个goroutine,一个运行,一个阻塞
package main


import (
   "fmt"
   "sync"
)


func main()  {
   go count()


   go wait()


   wait()
}


func count()  {
   count := 0
   for {
      count = count + 1
      if count % 1000000000 == 0 {
         fmt.Println("I'm a running routine")
      }
   }
}


func wait()  {
   wg := sync.WaitGroup{}
   wg.Add(1)
   wg.Wait()
}
运行起来,然后使用dlv进行attach,如下图(具体命令可以attach后使用help查看)
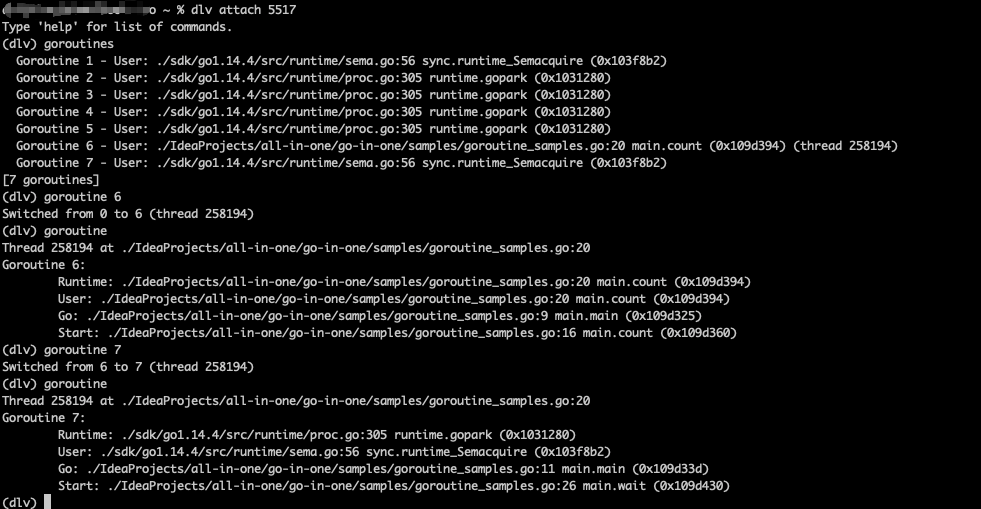 这样很方便地看到了各个goroutine在干啥
<END>
【新产品上架】 ?
脚本之家严选 , 交易担保 , 放心买 , 程序员极客圆领卫衣 小程序
推荐阅读:

 :
:每日打卡赢积分兑换书籍入口


文章评论