

作者 | 阿文,责编 | 郭芮
头图 | CSDN 下载自东方IC
出品 | CSDN(ID:CSDNnews)

Prometheus 优势

Prometheus 不适合哪些场景?

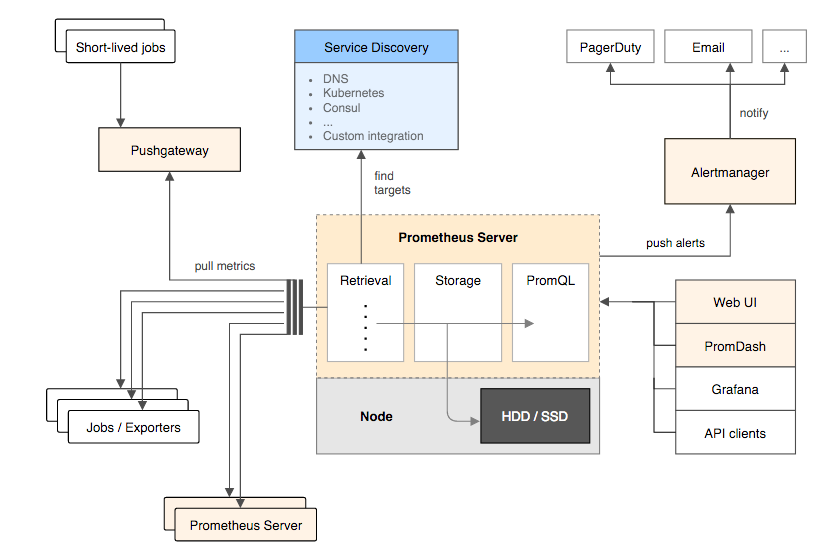
Prometheus 架构
-
Prometheus Server: 用于收集和存储时间序列数据。Prometheus Server是Prometheus组件中的核心部分,负责实现对监控数据的获取,存储以及查询。Prometheus Server可以通过静态配置管理监控目标,也可以配合使用Service Discovery的方式动态管理监控目标,并从这些监控目标中获取数据。其次Prometheus Server需要对采集到的监控数据进行存储,Prometheus Server本身就是一个时序数据库,将采集到的监控数据按照时间序列的方式存储在本地磁盘当中。最后Prometheus Server对外提供了自定义的PromQL语言,实现对数据的查询以及分析。
-
Client Library: 客户端库,为需要监控的服务生成相应的 metrics 并暴露给 Prometheus server。当 Prometheus server 来 pull 时,直接返回实时状态的 metrics。
-
Push Gateway: 主要用于短期的 jobs。由于这类 jobs 存在时间较短,可能在 Prometheus 来 pull 之前就消失了。为此,这些 jobs 可以直接向 Prometheus server 端推送它们的 metrics。
-
Exporters: 用于暴露已有的第三方服务的 metrics 给 Prometheus。Exporter将监控数据采集的端点通过HTTP服务的形式暴露给Prometheus Server,Prometheus Server通过访问该Exporter提供的Endpoint端点,即可获取到需要采集的监控数据。
-
Alertmanager: 从 Prometheus server 端接收到 alerts 后,会进行去除重复数据,分组,并路由到对方的接受方式,发出报警。常见的接收方式有:电子邮件,pagerduty 等。
-
WEB UI:Prometheus Server内置的Express Browser UI,通过这个UI可以直接通过PromQL实现数据的查询以及可视化。
一些其他的工具。

特点
-
多维数据模型(有metric名称和键值对确定的时间序列)
-
灵活的查询语言
-
不依赖分布式存储
-
通过pull方式采集时间序列,通过http协议传输
-
支持通过中介网关的push时间序列的方式
-
监控数据通过服务或者静态配置来发现
-
支持图表和dashboard等多种方式
-
Prometheus主服务器,用来收集和存储时间序列数据
-
应用程序client代码库
-
短时jobs的push gateway
-
基于Rails/SQL的GUI dashboard
-
特殊用途的exporter(包括HAProxy、StatsD、Ganglia等)
-
用于报警的alertmanager
-
命令行工具查询
-
大多数的组件都是用Go来完成的,使得它们方便构建和部署。

下载运行
-
官网网站 https://prometheus.io/
-
下载地址 https://github.com/prometheus/prometheus/releases
[root@k8s prometheus-2.15.0.linux-amd64]# ls
console_libraries  consoles  data  LICENSE  NOTICE  prometheus  prometheus.yml  promtool  tsdb
[root@k8s prometheus-2.15.0.linux-amd64]# ./prometheus
level=info ts=2019-12-24T06:34:56.601Z caller=main.go:294 msg="no time or size retention was set so using the default time retention" duration=15d
level=info ts=2019-12-24T06:34:56.601Z caller=main.go:330 msg="Starting Prometheus" version="(version=2.15.0, branch=HEAD, revision=ec1868b0267d13cb5967286fd5ec6afff507905b)"
level=info ts=2019-12-24T06:34:56.601Z caller=main.go:331 build_context="(go=go1.13.5, user=root@240f2f89177f, date=20191223-12:03:32)"
level=info ts=2019-12-24T06:34:56.601Z caller=main.go:332 host_details="(Linux 3.10.0-957.el7.x86_64 #1 SMP Thu Nov 8 23:39:32 UTC 2018 x86_64 k8s (none))"
level=info ts=2019-12-24T06:34:56.601Z caller=main.go:333 fd_limits="(soft=1024, hard=4096)"
level=info ts=2019-12-24T06:34:56.602Z caller=main.go:334 vm_limits="(soft=unlimited, hard=unlimited)"
level=info ts=2019-12-24T06:34:56.604Z caller=main.go:648 msg="Starting TSDB ..."
level=info ts=2019-12-24T06:34:56.604Z caller=web.go:506 component=web msg="Start listening for connections" address=0.0.0.0:9090
level=info ts=2019-12-24T06:34:56.607Z caller=head.go:584 component=tsdb msg="replaying WAL, this may take awhile"
level=info ts=2019-12-24T06:34:56.612Z caller=head.go:632 component=tsdb msg="WAL segment loaded" segment=0 maxSegment=2
level=info ts=2019-12-24T06:34:56.616Z caller=head.go:632 component=tsdb msg="WAL segment loaded" segment=1 maxSegment=2
level=info ts=2019-12-24T06:34:56.617Z caller=head.go:632 component=tsdb msg="WAL segment loaded" segment=2 maxSegment=2
level=info ts=2019-12-24T06:34:56.618Z caller=main.go:663 fs_type=EXT4_SUPER_MAGIC
level=info ts=2019-12-24T06:34:56.618Z caller=main.go:664 msg="TSDB started"
level=info ts=2019-12-24T06:34:56.619Z caller=main.go:734 msg="Loading configuration file" filename=prometheus.yml
level=info ts=2019-12-24T06:34:56.620Z caller=main.go:762 msg="Completed loading of configuration file" filename=prometheus.yml
level=info ts=2019-12-24T06:34:56.620Z caller=main.go:617 msg="Server is ready to receive web requests."

配置文件
prometheus --config.file=prometheus.yml
# cat prometheus.yml
# my global config
global:
  scrape_interval:     15s # Set the scrape interval to every 15 seconds. Default is every 1 minute.
  evaluation_interval: 15s # Evaluate rules every 15 seconds. The default is every 1 minute.
  # scrape_timeout is set to the global default (10s).

# Alertmanager configuration
alerting:
  alertmanagers:
  - static_configs:
    - targets:
      # - alertmanager:9093

# Load rules once and periodically evaluate them according to the global 'evaluation_interval'.
rule_files:
  # - "first_rules.yml"
  # - "second_rules.yml"

# A scrape configuration containing exactly one endpoint to scrape:
# Here it's Prometheus itself.
scrape_configs:
  # The job name is added as a label `job=<job_name>` to any timeseries scraped from this config.
  - job_name: 'prometheus'

    # metrics_path defaults to '/metrics'
    # scheme defaults to 'http'.

    static_configs:
    - targets: ['localhost:9090']
-
global 全局配置
-
alerting 用来接收prometheus发出的告警,然后按照配置文件的要求,将告警用对应的方式发送出去。
-
rule_files 指定加载的告警规则文件
-
scrape_configs 指定prometheus要监控的目标
-
scrape_interval: 15s #每15s采集一次数据
-
evaluation_interval: 15s #每15s做一次告警检测
- job_name: prometheus
  static_configs:
    - targets: ['localhost:9090']
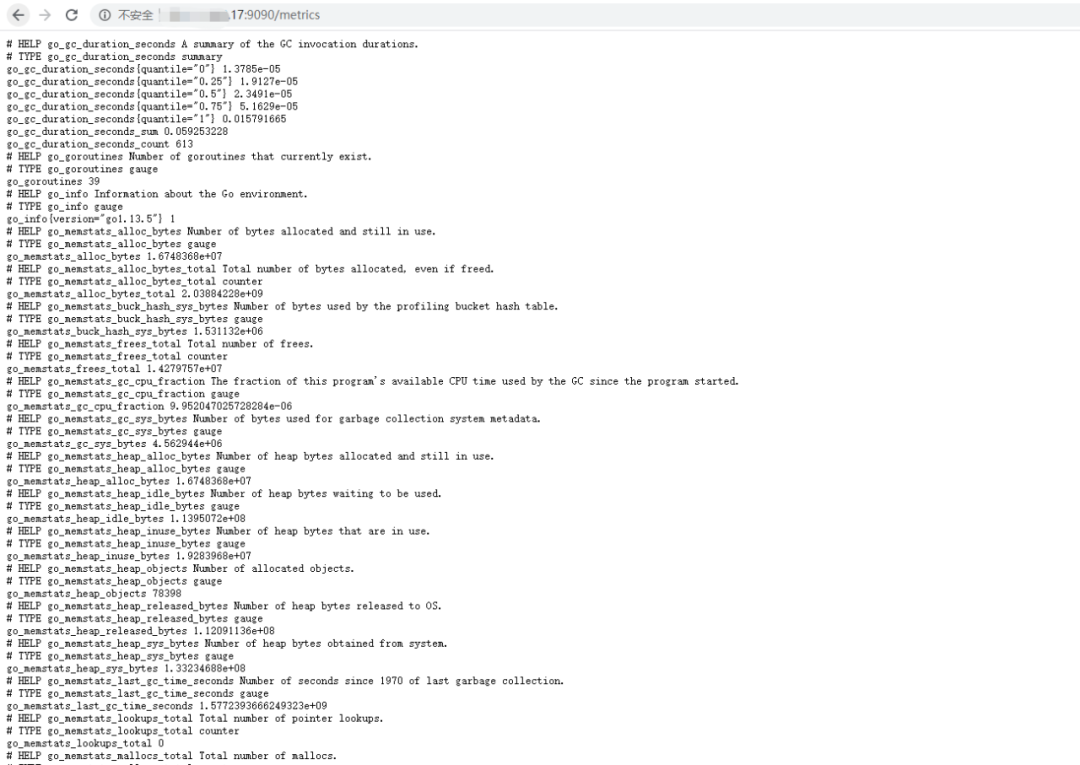
http://host:9090/metrics,即可看到一个instance向外暴露的监控指标。除了注释外,其它每一行都是一个监控指标项,大部分指标形如:go_info{version="go1.10.3"} 1
go_info即为度量指标名称,version为这个度量指标的标签,go1.10.3为这个度量指标version标签的值,1为这个度量指标当前采样的值,一个度量指标的标签可以有0个或多个标签。这就是上面说到的监控指标数据模型。go_memstats_frees_total 131961
_total为后缀的度量指标一般类型是counter计数器类型。go_memstats_gc_sys_bytes 213408
prometheus_http_response_size_bytes_bucket{handler="/metrics",le="100"} 0prometheus_http_response_size_bytes_bucket{handler="/metrics",le="1000"} 0prometheus_http_response_size_bytes_bucket{handler="/metrics",le="10000"} 46prometheus_http_response_size_bytes_bucket{handler="/metrics",le="100000"} 46prometheus_http_response_size_bytes_bucket{handler="/metrics",le="1e+06"} 46prometheus_http_response_size_bytes_bucket{handler="/metrics",le="1e+07"} 46prometheus_http_response_size_bytes_bucket{handler="/metrics",le="1e+08"} 46prometheus_http_response_size_bytes_bucket{handler="/metrics",le="1e+09"} 46prometheus_http_response_size_bytes_bucket{handler="/metrics",le="+Inf"} 46prometheus_http_response_size_bytes_sum{handler="/metrics"} 234233prometheus_http_response_size_bytes_count{handler="/metrics"} 46
go_gc_duration_seconds{quantile="0"} 7.3318e-05go_gc_duration_seconds{quantile="0.25"} 0.000118693go_gc_duration_seconds{quantile="0.5"} 0.000236845go_gc_duration_seconds{quantile="0.75"} 0.000337872go_gc_duration_seconds{quantile="1"} 0.000707002go_gc_duration_seconds_sum 0.003731953go_gc_duration_seconds_count 14

Prometheus 的一些概念
job: api-server instance 1:1.2.3.4:5670 instance 2:1.2.3.4:5671 instance 3:5.6.7.8:5670 instance 4:5.6.7.8:5671
自动化生成的标签和时间序列
-
job: 目标所属的配置任务名称api-server。
-
instance: 采样点所在服务: host:port 如果以上两个标签二者之一存在于采样点中,这个取决于honor_labels配置选项。
-
up{job=”[job-name]", instance="instance-id”}: up值=1,表示采样点所在服务健康; 否则,网络不通, 或者服务挂掉了
-
scrape_duration_seconds{job=”[job-name]", instance=”[instance-id]"}: 尝试获取目前采样点的时间开销
-
scrape_samples_scraped{job=”[job-name]", instance=”[instance-id]"}: 这个采样点目标暴露的样本点数量
metrics和labels(度量指标名称和标签)
http_requests_total- 接收http请求的总计数). metric度量指标命名ASCII字母、数字、下划线和冒号,他必须配正则表达式[a-zA-Z_:][a-zA-Z0-9_:]*。/api/tracks的http请求,打上method=POST的标签,则形成了具体的http请求)。这个查询语言在这些度量和标签列表的基础上进行过滤和聚合。改变任何度量上的任何标签值,则会形成新的时间序列图[a-zA-Z_][a-zA-Z0-9_]*。带有_下划线的标签名称被保留内部使用。有序的采样值
-
一个64位的浮点值
-
一个精确到毫秒级的时间戳 一个样本数据集是针对一个指定的时间序列在一定时间范围的数据收集。
Notation(符号)
[metric name]{[label name]=[label value], …}
api_http_requests_total, 标签为method="POST", handler="/messages" 的示例如下所示:api_http_requests_total{method="POST”, handler=”/messages”}
Counter(计数器)
Gauge(测量器)
Histogram(柱状图)
-
对每个采样点进行统计,打到各个分类值中(bucket)
-
对每个采样点值累计和(sum)
-
对采样点的次数累计和(count)
[basename]的柱状图, 上面三类的作用度量指标名称:-
[basename]_bucket{le="上边界”}, 这个值为小于等于上边界的所有采样点数量
-
[basename]_sum
-
[basename]_count
总结:类似histogram柱状图,summary是采样点分位图统计,(通常的使用场景:请求持续时间和响应大小)。它也有三种作用:
-
对于每个采样点进行统计,并形成分位图。(如:正态分布一样,统计低于60分不及格的同学比例,统计低于80分的同学比例,统计低于95分的同学比例)
-
统计班上所有同学的总成绩(sum)
-
统计班上同学的考试总人数(count)
[basename]的summary 在抓取时间序列数据展示。-
观察时间的φ-quantiles (0 ≤ φ ≤ 1), 显示为
[basename]{分位数="[φ]"} -
[basename]_sum, 是指所有观察值的总和 -
[basename]_count, 是指已观察到的事件计数值

自定义监控上报
系统自带的 exporter
# curl -Lo /etc/yum.repos.d/_copr_ibotty-prometheus-exporters.repo https://copr.fedorainfracloud.org/coprs/ibotty/prometheus-exporters/repo/epel-7/ibotty-prometheus-exporters-epel-7.repo
# yum install node_exporter
node_exporter
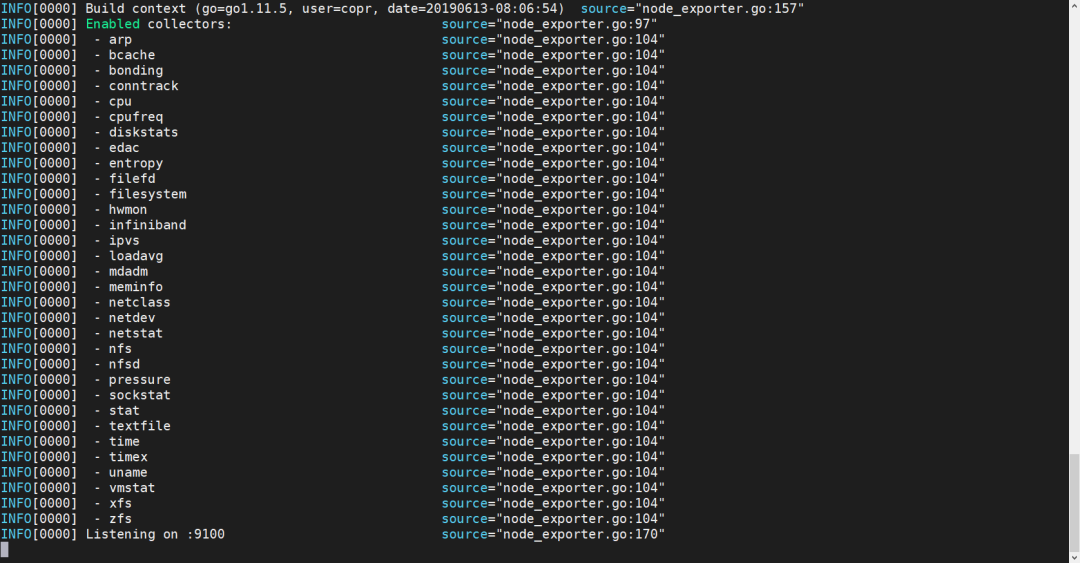
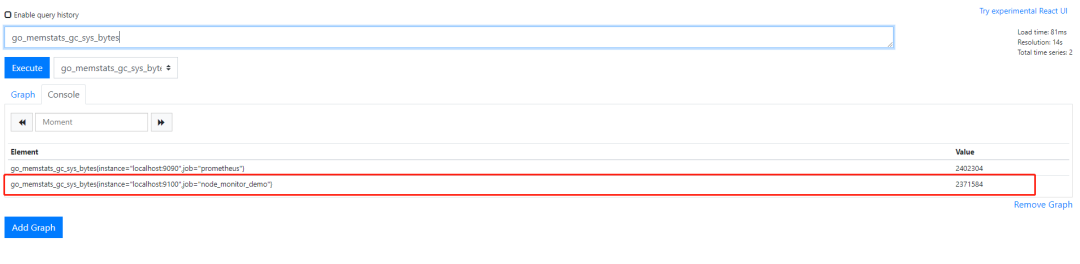
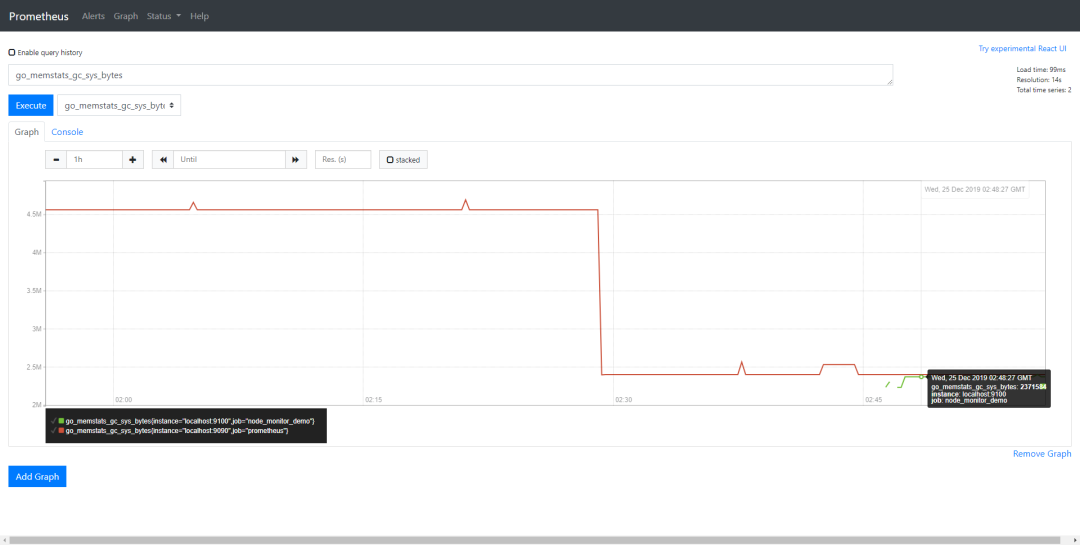
http://${host_ip}:9100/metrics即可看到node_exporter暴露出的这个宿主机各类监控指标数据: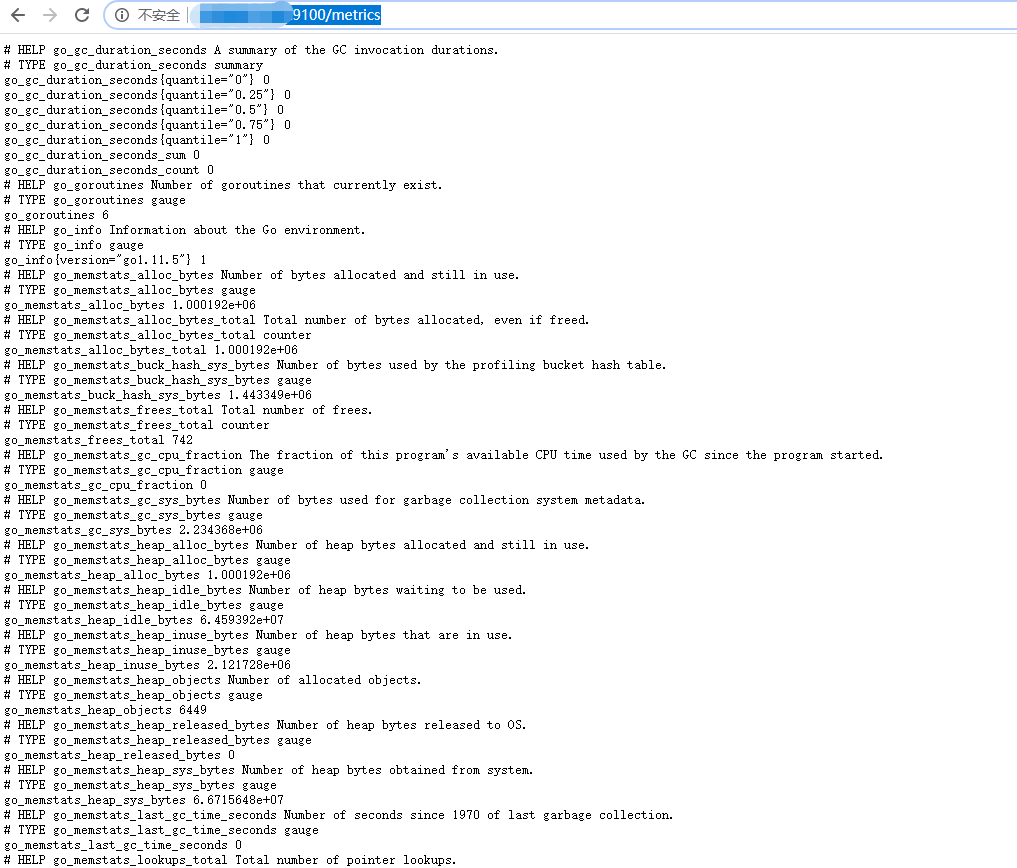
scrape_configs:
  ......
  - job_name: 'node_monitor_demo'
    static_configs:
    - targets: ['${host_ip}:9100']
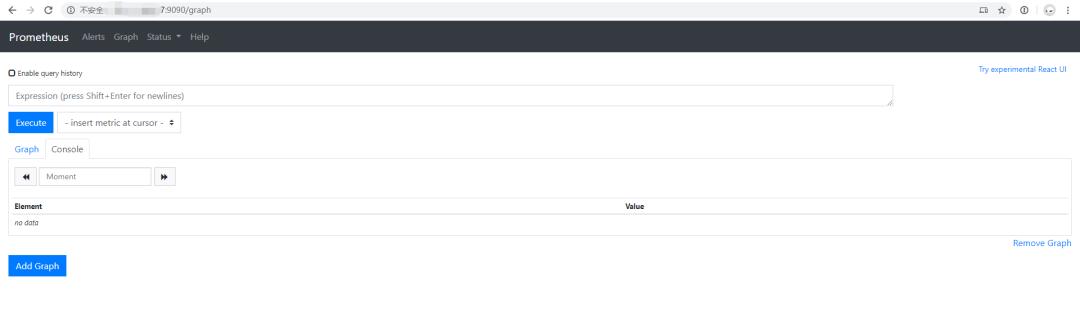
http://${HOST}:9090/graph界面里输入go_memstats_alloc_bytes{instance="${host_ip}:9100"}点击Execute按钮即可。将 ${host_ip} 替换成你的IP

新勋章,新奖品,高流量,还有更多福利等你来拿
更多精彩推荐
☞AI 换脸项目 ALAE 登顶 Github,AI 换脸又升级?
☞用 Python 实现手机自动答题,这下百万答题游戏谁也玩不过我!
☞IDEA 惊天 bug:进程已结束,退出代码 1073741819
你点的每个“在看”,我都认真当成了喜欢


文章评论